Landscape Architects and Computer Scientists Collaborate to Create a Perfect Storm of Understanding—About the Weather
By Lori Cameron

What do you get when computer science collides with art?
How about a weather report.
Seriously.
That's what computer scientists from the University of Minnesota and their architectural colleagues—the landscape and building kind, not the computing hardware type—did when they created the art exhibit "Weather Report."
The veritable work of art featured nearly a thousand colorful balloons, all artistically and accurately representing weather patterns in a tangible, concrete way.
Visitors could touch and interact with the exhibit—meeting the researchers' primary goal to make abstract scientific data accessible to non-scientists. The exhibit was part of the 2016 Northern Spark Art Festival held in Minneapolis-Saint Paul. The all-night event lights up the city, and the year's theme was "Climate Chaos | Climate Rising."
The collaboration between architects, landscape architects, and computer scientists in creating the Weather Report artwork proved to be both challenging and rewarding.
"Our experience and results reflect months of discussion, much of it devoted to learning to speak the language of each other’s disciplines. The whole team had to work within the constraints of an outdoor, dusk-to-dawn festival and a specific site. Each discipline had to stretch to accommodate the interests and expertise of the other," say the authors of "Weather Report: A Site-Specific Artwork Interweaving Human Experiences and Scientific Data Physicalization."
The balloons serve as pixels displaying weather data.
"Inspired by the role weather balloons play in data collection, we came to view the balloon as a simple, physical, relatable manifestation of the scientific process. Each weather balloon provides a small data-driven contribution to the larger picture of the science," say the authors.
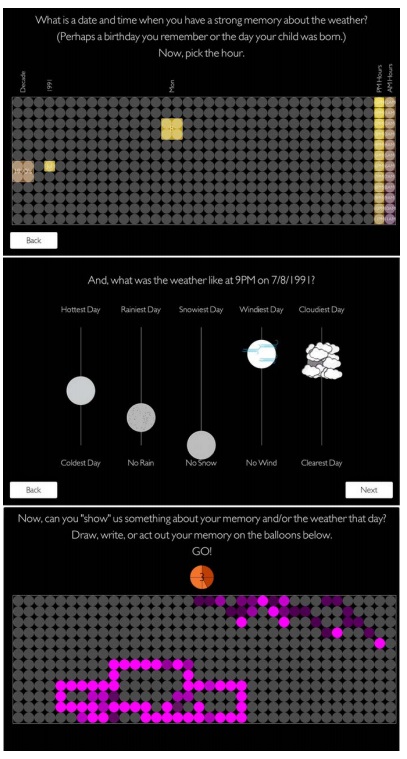
Visitors can also record their own weather-related memories of the Twin Cities at a kiosk. The stories add a subjective element to the exhibit.
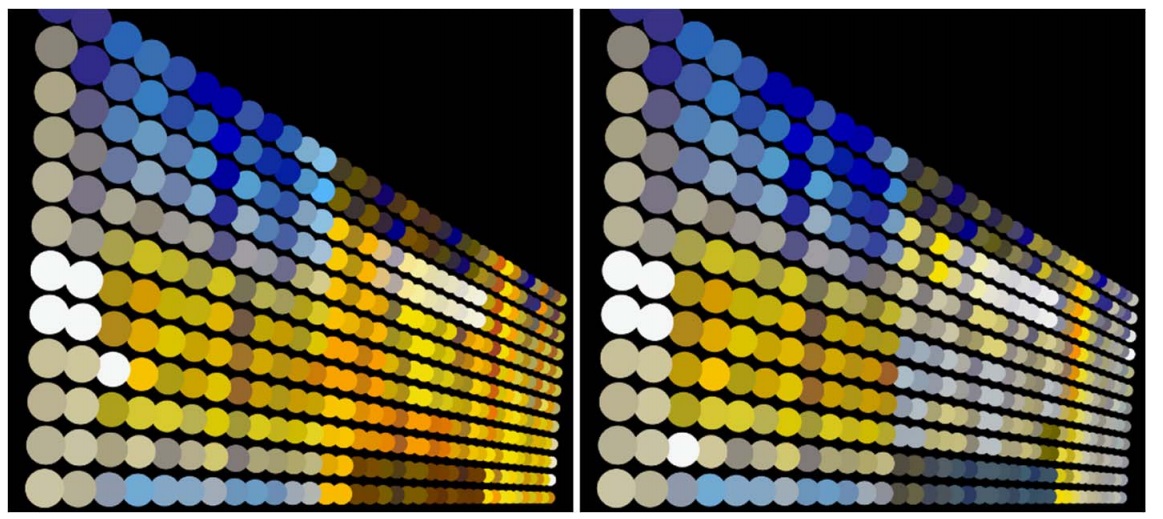
In the two pictures below, rain, snow, wind speed, and cloud cover are regarded as separate events. For a rain event, blue pixels stream down the wall. Snow events create slower, gentler white pixels wafting down the wall. Cloud-cover events tint the top of the wall in a light gray, and wind events cause gray particles to fly across the wall from one side to the other.
Below is the data-to-visual mapping for each wall, which uses a hierarchical arrangement for time. Decades are displayed in the two leftmost columns, with the current decade highlighted, followed by months of the year with the current month highlighted, followed by days of the month, and so on. As such, 7 a.m. on Tuesday, 24 June 2016 is highlighted in this figure.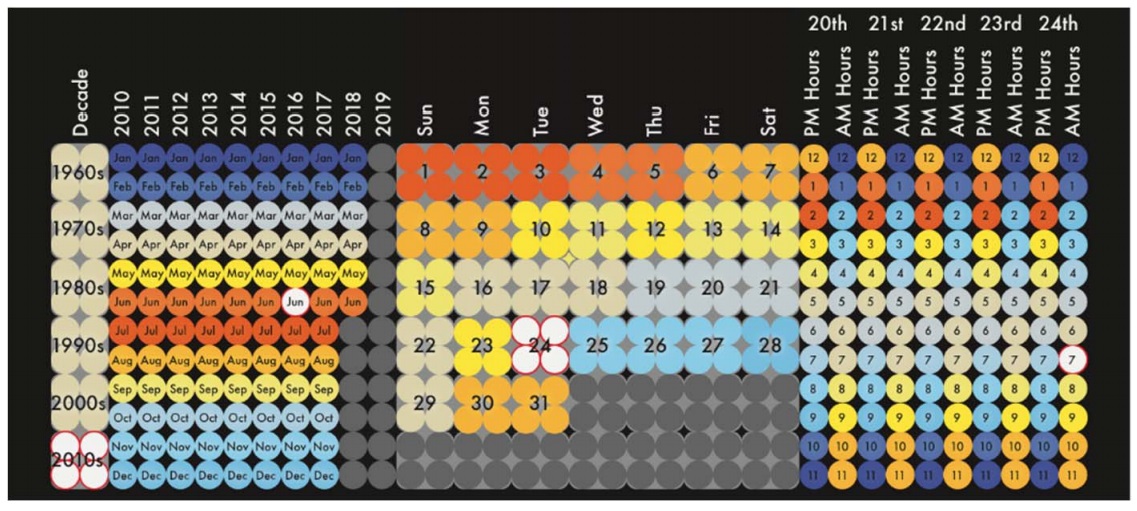
The beauty of the exhibit belies the technical skill it took to put it together.
"The balloons are lit from outside the tunnel by four short-throw projectors and a custom graphics program with five coordinated output windows. Calibration is critical because the site, next to the river and a hill, requires projecting from extreme angles. The projected graphics are created by first rendering a regular grid of 2D colored circles to an off-screen buffer. Then, this temporary image is texture mapped onto a deformable four-sided polygon. To calibrate each projector, a keyboard user interface is used to interactively adjust the coordinates of the corners of the polygon, skewing it until the colored circles project onto the correct balloons," the authors say.
The festival attracts tens of thousands of people each year who can enjoy live performances and art exhibits all night long. In 2016, one of those exhibits was Weather Report.
"A stream of local residents and visitors wind down from the bridge, through Mill Ruins Park, and along the walking path to what people are describing as the 'balloon tunnel.' More than 800 miniature weather balloons are suspended to form two walls that undulate, like air-filled sheets in the night wind. Both the balloons and the steady stream of visitors perform an animated dance as the Mississippi River flows by on a parallel course," they add.
The authors are Daniel F. Keefe, Seth Johnson, Deuk-Geun Hong, Andrea J. Johnson, and Mark Swackhamer of the University of Minnesota; Ross Altheimer and Maura Rockcastle of TENxTEN Studio; Robert Hunter of James Dayton Design, Ltd; and Aaron Wittkamper of Wittkamper/Reiff.
The way visitors interacted with the exhibit was both predictable and unpredictable.
"People walked through the tunnel and around the sides. They touched the balloons as they walked. More than 200 people contributed memories to the subjective weather record," the authors say.
"The biggest surprise was in how viewers reacted to the projection. The projection beams became interactive play areas, places for visitors to dance, pose for pictures with data covering their bodies, and cast shadows on the data that could be seen from across the river and around the festival. Visually, this added another layer of human connection and embodied movement to the data-driven visuals," they add.
Related research on data visualization in the Computer Society Digital Library:
- Sports Data Visualization
- Human-Centered Data Visualization
- The Need to Help Journalists with Data and Information Visualization
- Data-Driven Healthcare: Challenges and Opportunities for Interactive Visualization
- Characterizing Visualization Insights from Quantified Selfers' Personal Data Presentations
- Parallel Coordinates for Multidimensional Data Visualization: Basic Concepts
- A High-level Language for Interactive Data Visualization

About Lori Cameron
Lori Cameron is a Senior Writer for the IEEE Computer Society and currently writes regular features for Computer magazine, Computing Edge, and the Computing Now and Magazine Roundup websites. Contact her at l.cameron@computer.org. Follow her on LinkedIn.


